Editorial comparison
Bookmap vs ATAS: resting liquidity, footprint and data connections
Bookmap and ATAS offer different ways to read market activity. Compare resting liquidity with executed volume, match connections to practice and execution, and budget for licences and data separately.

Bookmap or ATAS: start with the question the screen must answer
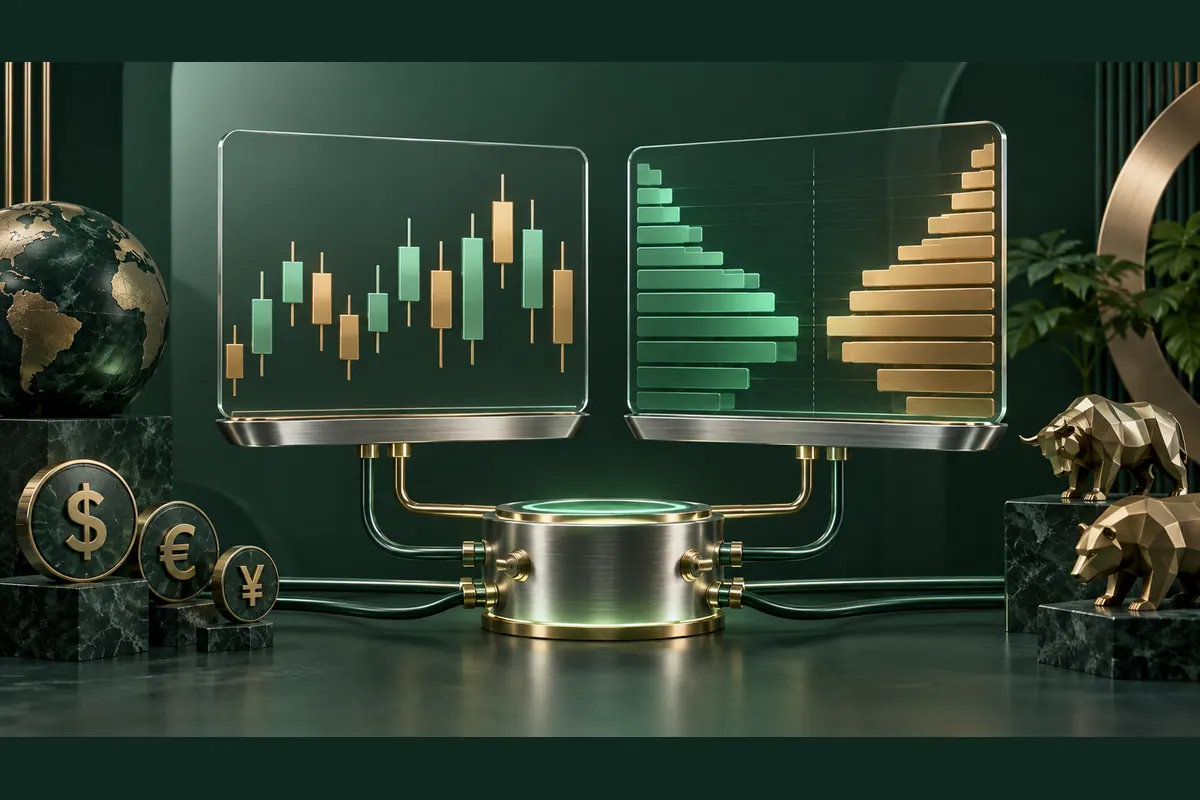
Bookmap suits examination of how resting liquidity changes over time, while ATAS offers a volume-analysis environment with footprint charts, delta and an order book. That is a starting point rather than a rigid division: Bookmap also includes additional volume tools, and ATAS documents a beta heatmap. The useful question is what information your existing workflow lacks and which connection can supply it.
Scroll the table horizontally to read every column.
| Question to examine |  Bookmap Bookmap |  ATAS ATAS |
|---|---|---|
| Liquidity before execution | Order-book heatmap | Order book and beta Heatmap |
| Volume already executed | Volume dots and delta tools | Footprint and cluster charts |
| Revisiting historical data | Recording and replay on a suitable plan | Replay with compatible plan and data |
A trader examining why price paused near a level may want to follow changes in orders, executed transactions and the price response. Someone studying the volume distribution within a candle may concentrate on cells at each price. These tasks are related but require different attention. A large tool collection cannot replace a clearly defined question.
Before comparing subscriptions, describe the workflow: market, contract or pair, holding period, information needed at decision time and information to review afterward. This makes recurring use, rather than an attractive screenshot, the basis for choosing a screen. The Bookmap review explains the software's role within that service chain.
What a Bookmap liquidity band shows and leaves unresolved
Bookmap's heatmap describes pending orders in the book supplied by the selected connection. When a band becomes brighter, inspect the colour scale and displayed quantity. Contrast, cut-offs and depth aggregation can change the picture without an equivalent change in order quantity. Strong colour alone is therefore not a comparable measure across two screens.
The distinction between a resting order and an executed trade changes interpretation. Displayed size near a price is not a commitment to remain there until price arrives. For review, record the sequence: whether size stayed, decreased, increased or disappeared; whether executions appeared at the same time; and what price did. Do not attribute an order owner's intention simply because a band changed.
A useful exercise is to describe one event in words before drawing a conclusion. For example, displayed liquidity grew, executions then occurred nearby, and price moved through the level. This separates observation from hypothesis. Expressions such as an impenetrable wall or smart money knowing the future add certainty the display does not establish.
Data boundaries matter as well. A book from one exchange or connector is the view that service supplies, rather than necessarily the entire market. When comparing with ATAS, ask whether both screens use the same source and depth. Otherwise, a visual difference may reflect the connection rather than an advantage of either application.
ATAS footprint cells versus Bookmap volume dots
ATAS footprint charts arrange executed volume by price within a bar. Bid × Ask separates the sides, while delta emphasizes their difference. Bookmap volume dots place executions on a price-and-time sequence. Zoom and aggregation affect a dot, so an individual circle should not be assumed to represent one execution by one participant.
For an arithmetic example only, suppose a futures cell records 70 contracts on the Ask side and 30 on the Bid side. Total volume is 100 contracts and delta is positive 40 contracts. These are not market observations or a signal. Delta describes the distribution under the selected classification; it does not prove that price must rise or that a particular group holds an open position.
Add context when reading a cell. Was the level near the bar's edge or its centre, was volume large compared with the rest of that segment, and did price advance after execution? The same delta can occur within a small bar or a broad move. A useful comparison concerns predefined scenarios rather than colours that look persuasive afterward.
Changing the view changes more than appearance. Cells let you compare adjacent price levels; dots make an event sequence easier to follow without waiting for a candle to close. Choose a reading method you can explain and reproduce in a journal. The ATAS footprint guide expands on volume, delta and display settings.
A shared data check before comparing Bookmap and ATAS
A fair comparison starts with the same instrument and time segment. For futures, record the exact contract, session hours and time zone. For crypto, record the exchange and pair. A similar name or continuous chart does not establish that both screens show the same activity. Live data and history loaded after connection are also different categories of information.
Each view needs suitable input. Price candles, individual executions and order-book updates are not interchangeable. A liquidity map requires book information, while volume analysis by price depends on executions and their classification. Purchasing a higher licence tier does not automatically supply a field missing from the connector or history it does not offer.
ATAS documents specific dxFeed limitations: cluster support on minute and second charts, and no Replay support for dxFeed instruments. These apply to the documented connector, rather than all ATAS data. Bookmap users should likewise examine provider, instrument and service type before choosing a tool requiring particular information.
A practical check can begin with a short list of known facts: whether sessions match, whether data is delayed, whether depth arrives, and whether history covers the event you want to study. If a question remains unresolved, obtain an answer from the relevant service before purchasing. Correcting settings here is preferable to conclusions based on two pictures that are not comparable.
Order execution: the licence does not replace the broker account
Bookmap and ATAS are software; the trading account, funds and permissions remain with the connected service. Stock and futures order execution in Bookmap requires Global Plus and a supported connection. A data-only feed does not become a trading account. In ATAS, select the quote source and destination execution account separately, following connector and broker instructions.
This distinction matters when analysing an instrument on one screen and executing through another account. Confirm that the displayed contract or symbol is the intended order destination and that order size uses the correct unit. A broad depth display does not confirm permission to trade that market. Interface language does not establish residence or eligibility either.
ATAS's Rithmic documentation gives a concrete warning: OCO orders are simulated locally, so disconnection can prevent the second order being cancelled after the first fills. Do not extend that warning to every connector, but understand it if you choose this connection. Two linked orders on screen do not prove their relationship continues when the application disconnects.
Before using real money, evaluation should check symbol, account, quantity, order status and a direct broker-side verification route. Practice does not eliminate slippage or communication failure and does not establish profitability. The question is whether the order path is understandable and inspectable, rather than which application promises perfect execution.
Bookmap versus ATAS budgeting: buy a need, not a feature list
A workflow budget includes software, data, add-ons and account or transaction costs. You can compare licence charges separately, but should not call them the total when an additional data subscription is required. Bookmap explicitly separates live stock and futures data. ATAS Pro and Ultra permit those connections; connection capability does not purchase exchange entitlements.
Instead of comparing each provider's cheapest tier, prepare identical requirements. For example: analysing a live contract, viewing its book, revisiting a historical event and monitoring a limited instrument set. Identify the licence and feed covering each requirement. A basic crypto licence with delayed futures is not equivalent to a live-futures workspace.
Annual purchasing also affects cash flow. A displayed monthly equivalent is not necessarily an amount payable monthly. Keep billing period, total payment and renewal conditions beside the requirements list. Do not justify the expense with unrealized future profits or assume the software will prevent losses.
Check an interesting add-on separately: whether it is included, what data it requires and whether it works with your chosen connector. A tool incompatible with your feed does not become useful because its name appears on a plans page. The ATAS plans comparison helps break software licensing into capacity and billing periods.
Practice and review without confusing Replay with live trading
Replay helps examine a data sequence that a single screenshot cannot show. Bookmap documents recording and replay on suitable plans. ATAS Replay offers different information levels: candles, transactions, or transactions with the order book. Reviewing a heatmap or DOM requires the book layer, rather than candles merely resembling the original segment.
ATAS's current manual separates training orders from the broker and states that simulator fills are immediate and complete. Live trading also involves queues, partial fills, slippage and broker behaviour. This changes what a practice exercise can establish. You can examine whether you recognized a situation in time without claiming you would have obtained the same real-money fill.
Define a starting point, question and invalidation condition before practice. Pause before revealing subsequent price action and write your interpretation. Continue and assess whether the description remained consistent. On a familiar segment, separate remembering the outcome from reading the information. This is a learning method rather than a test producing an expected return.
Keep session, filter and data settings beside your notes. Starting a new ATAS training session can replace the previous results, so preserve anything needed before moving on. Do not assume two Replay tools are equivalent because both have a play button; examine data, fill rules and retained results separately.
Moving between ATAS and Bookmap: reproduce settings, not just colours
Start a software transition with a small workspace. Choose a familiar instrument, one feed and one main view. Add another tool only when it answers a specific question. Opening many windows immediately makes it harder to distinguish data problems, configuration errors and computer load.
Settings do not always translate directly. An aggregated dot is not a footprint cell, and heatmap contrast is not an imbalance threshold. Rather than copying colour, describe what a marker should represent. You can then locate an appropriate setting in the new application and inspect it on the same segment, without assuming identical names produce identical calculations.
Check the version and connector at computer level too. Bookmap is desktop software with varying requirements and adapters. ATAS Classic and ATAS X Beta are different versions; a Classic tool is not automatically available in X. Before changing operating systems, inspect the tools and connections you actually need rather than merely the existence of an installer.
A sound transition also preserves habits: saving notes, returning to data and checking orders directly with the broker. Keep original files and journal context before removing an earlier environment. If the new software solves only part of the problem, different uses can coexist. A clear decision does not require a complete replacement.
Choosing Bookmap or ATAS for a defined workflow
For someone concentrating on liquidity changes before and during price interaction with a level, Bookmap directly displays that sequence. For someone reading volume distribution across prices within a candle and combining it with other analytical tools, ATAS offers a broad footprint environment. This is a match to a question and reading method, rather than a claim that one display produces more profitable decisions.
A futures trader with a compatible existing feed should start with that connection: does it support the required analysis, history and execution in each application? A crypto user should start with the exchange and pair under examination. A learner studying the difference between book and executions can use appropriate data or practice without presenting it as a complete live-trading setup.
If considering both applications, give each a role. One screen might address liquidity and another summarize executed volume. Examine whether the second role adds information or repeats something already read effectively. Duplicate screens can add cost and maintenance time even when individual features are useful.
A good evaluation produces a short decision record stating the choice, required feed, settings and remaining provider checks. Include a reason to discontinue use, such as a tool failing to fit the routine. The Bookmap and TradingView comparison adds broader charting considerations for needs extending beyond order-flow analysis.