
Editorial comparison
Bookmap vs TradingView: order books, charts and market data
Bookmap focuses on liquidity and executions over time; TradingView offers charts, alerts and scripts. Compare the data type, volume calculation and role of each application.
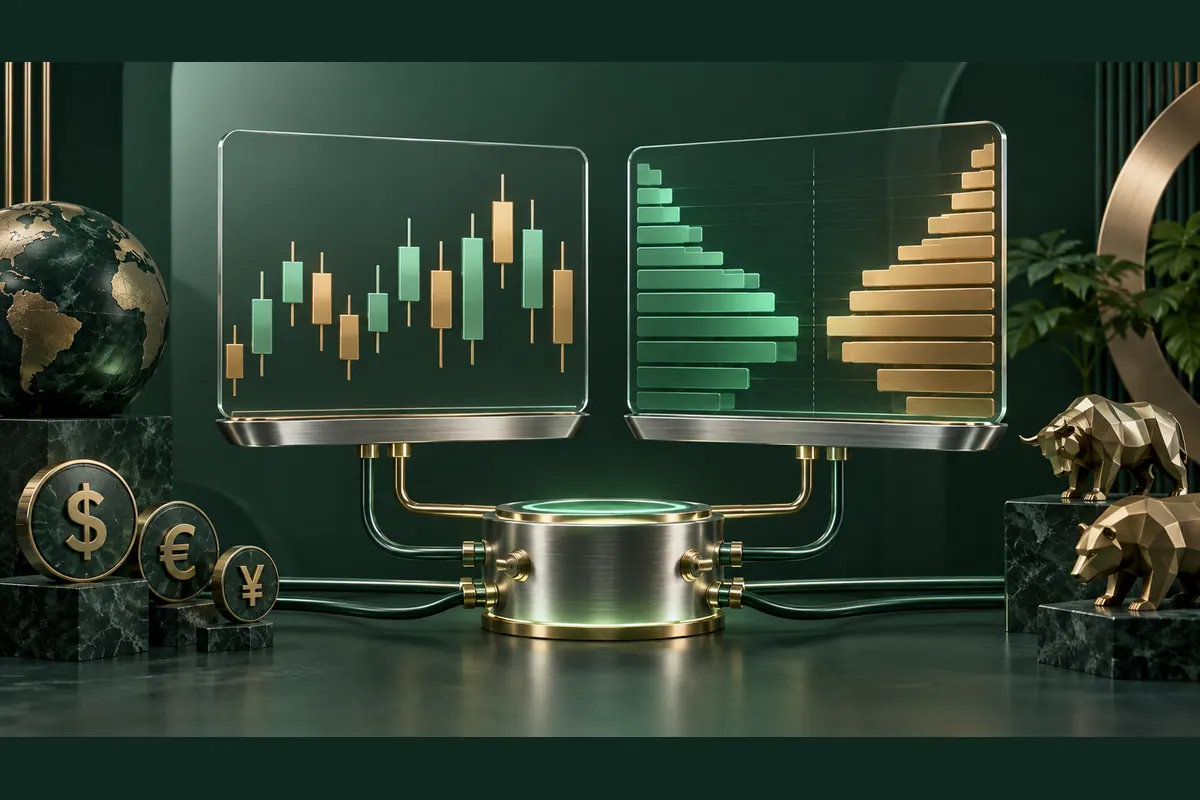
Bookmap and TradingView: define what you want to see
Bookmap and TradingView can fit into the same routine because they emphasize different information. Bookmap displays resting liquidity and executions over time from a suitable connection. TradingView offers broad charting, alerts and scripts, alongside documented volume-analysis tools. The decision concerns needed information and its calculation rather than which application has more colours or indicators.
Scroll the table horizontally to read every column.
| Decision dimension |  Bookmap Bookmap |  TradingView TradingView |
|---|---|---|
| Main view to examine | Book liquidity beside executed volume | Charts, indicators and alerts |
| Volume analysis | Dots and tools depending on plan and feed | Footprint and documented volume methods |
| Execution path | Supported account connection and suitable plan | Supported broker or external alert workflow |
An investor examining broad price structure may need only a chart with appropriate context. A trader studying order changes near a level may require detailed book information. The latter task is not necessary for everyone who trades, and the former is not exclusively for beginners. Extra detail should justify the time and expense it adds.
Before comparing, write down the decision: identifying a condition to monitor, timing another examination, or reviewing a completed trade. If adding a screen does not change the answer, the extra information may be unnecessary at this stage. The TradingView review separates charting tools from the broker's account conditions.
A Bookmap liquidity map is not a market-performance map
A heatmap can mean different things. A coloured stock map may show relative price performance across companies, while Bookmap's liquidity map describes pending orders at price levels through time. Similar colours do not make the underlying information equivalent. To understand a screen, identify its axes and what size and colour encode.
On a liquidity map, strong colour relates to displayed order quantity and scale settings. It should not be read as profit, return or a completed trade. Bookmap lets users change cut-offs, contrast and depth aggregation. Record these settings before comparing the view with another chart so interpretation does not change solely because of visual choices.
For a descriptive exercise, suppose a level shows substantial size that then disappears without corresponding executions. You can say displayed liquidity changed; this does not establish a participant's motive. If a price candle also moves, keep the descriptions separate. A candle summarizes a price range, while the book map supplies an additional activity layer.
When using TradingView for broad context and Bookmap for close examination, assign one question to each screen. The chart defines the area under review; the book helps describe activity there. This division is useful only when instrument and time match. It does not establish that the book knows the next candle's direction.
TradingView Footprint: classification comes before colour
TradingView documents Footprint charts, so portraying it as candle-only software misses part of the service. However, examine how volume is allocated. The official guide describes intrabar data and buy/sell categorization based on price direction within smaller intervals. Underlying historical granularity can change farther back in the chart.
This matters when comparing delta with execution dots or book data. Two values called buy volume need not use the same input or classification rule. Do not assume price-direction categorization is identical to aggressor-side trade classification from another connection. Even visually similar displays require a record of what each actually calculates.
For arithmetic only, suppose categorized buy volume is 120 units and categorized sell volume is 80 units. The sum is 200 and the difference is positive 40 units. The calculation is correct, but its interpretation depends on classification. These are not market observations, and the quantities do not predict movement or identify who initiated every actual execution.
During evaluation, choose a short segment and record interval, history depth and calculation method. Establish whether the information answers your question before purchasing a tier. TradingView versus ATAS expands the footprint and data comparison for readers considering another volume-analysis environment.
Bookmap and TradingView data: the same name is not the same source
Data is central to this comparison. Bookmap connects depth and trading-data services according to plan and adapter. TradingView states that a paid chart plan excludes most real-time stock and futures exchange fees. To compare cost and use, identify each chart's market source, live status and included information.
For US shares, the company name is insufficient. TradingView explains that default data comes from Cboe and may differ from the primary exchange. BookmapData Nasdaq stock data and CME futures MBO are different products. Do not assume any depth package describes every venue or order type.
A comparison record should specify symbol, exchange, contract where applicable, time zone, session hours and delay status. Then establish whether history and live information describe the same source. If screens disagree, adding an indicator is not the first remedy. Identify coverage or timing differences first.
Professional and nonprofessional data can carry different conditions. Personal software use does not remove data-service rules. Ask about the relevant classification and specific package cost before budgeting. This can prevent paying twice for the same information layer or achieving apparent savings that exclude information the workflow requires.
TradingView alerts and Bookmap execution: two different paths
An alert and an execution are different stages. TradingView can generate alerts and send messages to an external service through a webhook. A sent message does not prove an order was created, and a created order does not prove a fill. Broker-panel trading and external-alert workflows require different checks; do not merge them when evaluating software.
Bookmap stock and futures execution requires Global Plus and a suitable account connection. Here too, the screen is only part of the story: identify destination account, symbol and quantity. Paying for data does not create trading permission, and a licence does not establish that a broker accepts residents of a particular country.
If the objective is choosing an analytical screen, automation need not be added to justify the choice. If routing is the objective, define who calculates the condition, receives the message and returns execution status. Choose a way to inspect the actual position even when the chart is unavailable.
Check symbol and complete order path in practice before using real money. The exercise should answer operational questions, such as what happens without permission or during disconnection. It does not prove future executions will match. Liquidity data and alerts can describe conditions but do not remove financial risk or communication failures.
Bookmap recording and TradingView strategy testing
Define what must be reconstructed before comparing practice tools. Bookmap documents recording and replay on a suitable plan. A TradingView Pine strategy can generate hypothetical results through a broker emulator. Both involve historical examination, but they are different experiments and do not promise identical book detail or execution behaviour.
Pine documentation explains that the emulator uses chart data and assumptions about intrabar movement. A trade marker in a strategy report is therefore not a real broker confirmation. Preserve settings, hypothetical costs and calculation rules to understand the report. A test lacking relevant cost assumptions does not establish that the strategy would have survived those conditions in practice.
Liquidity recording can support a descriptive question: did resting size remain near the level, and did executions change the interpretation? Learning from that sequence does not require a profit report. You can examine whether notes were made at the time, were consistent and used information available before the outcome became visible.
Choose different events beforehand, including cases where the hypothesis failed. Keep source data, interpretation and simulation results separate. Replaying only attractive events makes it harder to identify when a tool supplies no answer. The purpose is to establish whether the reading method and data fit your process, rather than retrospectively crediting every move to the software.
The ongoing cost of working with Bookmap and TradingView
Cost comparison should concern the workspace you will use, rather than the first pricing row. Bookmap separates its licence from real-time stock and futures data and Marketplace purchases. TradingView users should separate chart plans, exchange data and broker or routing-service conditions where applicable. More screens are not automatically necessary for useful work.
Identify requirements justifying payment: simultaneous charts or symbols, active alerts, history, recording and execution tools. Check each against the tier and feed. Paying for depth makes little sense for general price monitoring, while a cheap subscription is unsuitable if it excludes book information needed for the exercise.
Keep billing period beside every checkout amount. An annual plan's monthly equivalent is not a subscription cancellable each month at that rate. Check currency, taxes, renewal and add-ons separately. Comparing currencies without a rate and date does not establish which service costs less for a particular user.
Operational time also affects the decision: configuring data, maintaining the workspace and preparing review records. You can estimate it in a personal log without presenting it as a measured provider benchmark. The Bookmap plans and market-data review separates the layers so you know what requires pricing and what depends on an existing connection.
Evaluate both applications on the same event and retain context
A sound evaluation starts with a defined event and a short question. For example, examine what changed near a price level chosen beforehand. In TradingView, record candle context and the relevant indicator; in Bookmap, record liquidity and executed volume. Then ask what each view added beyond information already available.
To keep the exercise fair, avoid changing several settings simultaneously. Retain source, session and zoom, and log one change at a time. If the result looks different, the record helps identify whether information or configuration changed. A screenshot without this context is less useful, even when visually detailed.
Separate an analytical screen from your actual trade journal. A chart or heatmap can help explain a decision, but the broker record establishes what filled and at what price. Attach the actual event and preceding assumption to the note. This prevents filling a record gap with an imagined chart-based outcome.
After several different exercises, decide whether one application or a combination is justified. Give each screen a clear role and choose a repeatable process. If the main requirement is analysing trades after execution, TraderSync versus TradingView examines charts versus journals and maintaining the connection between decisions and outcomes.
Who may need Bookmap and who may be served by TradingView
TradingView can be a suitable starting point for defining chart conditions, comparing price context and using alerts or scripts. Bookmap suits focused examination of resting liquidity and executions around price levels. This is a role-based assessment rather than a promise that either system fits every market, account or strategy.
If charts already provide clear answers, identify the gap before adding depth. A missing decision history may point to a journal as the next step. Missing book-change information may justify depth software with a compatible connection. Start with a describable problem instead of assuming every trader needs the same combination.
Users wanting both can assign broad charts to planning and book views to specific events. Later, assess whether that division remains useful or the screens distract from one another. No overall score is required: decide according to data questions, connection cost, computer requirements and maintenance time.
Buying software selects a work tool; it neither opens a trading account nor recommends a transaction. Check eligibility, market permissions and trading risk separately with the relevant services. A suitable choice supplies information you can interpret and verify within a budget and process you can sustain.